Home Climate Facts Climate Briefs Alarmist Rebuttals Failed Predictions Historic News Clipings News Reports Russian Money How They Lie to YOU Its OK to Lie! CO2 Facts Warm Periods Lack Of Data Electricity Cost Climate Is Normal Heat/Cold Deaths Wild Fires Green New Deal No Rapid Waring Sun - Real Cause of Climate Alarmist errors C13/C12 Isotope Ratio oregon_climate_plan Tipping Points Climate Predictions IPCC Says Our Best Data 22 Inconvenient Truths Medieval Warm Period Extinctions Propaganda Fossil Fuel subsidies Who's Lying? What is Real Science Peer Review Adjustment Example proxies Climate Papers Debunking Claims NASA Debunk Antarctic Loss Renewables Corals Trillion Dollar Industry Big Money Scaring green money Paid by fossil fuel Warming Stopped Media Lies People are Dying History (politics) Extreme Weather? Its Warming,But Acidification IPCC_Flawed IPCC Prediction Fail IPCC_Disproved IPCC_PeerReview IPCC Scientists IPCC&CLouds WWF Infiltrated the IPCC Harming People misconduct Data Adjustments Major Data Tampering Cooling since 1945? Drought, hurricanes etc. Arctic History Selected Emails Selected Quotes Fraud Of Century? 97 percent of scientists 97% is meaningless 25% of AMS / 50% JonesInterview An OK Prediction Data Sources Record Temperature Energy Facts GridStorage CostlyEnergy Michael Mann Mann's Book Wegman on Mann paper styn_vs_mann Peer Review Error Statistical Errors The Sun Solar OceanHeat Ocean Heat Polar Bears OK AlGore's Errors Ask Questions Climate Models Record Highs Local Food Threats Why I'm a Skeptic GreenhouseMoon Alternative Energy 1350+ realist papers Conflict of Interest? Muzzeled Scientists How To Argue Common Ground Hurricane No Proof NW Snow Pack James Hansen Consensus The Hockey Stick 650 Dissenters Easy Solution DataQuality Heat Island Is Science Settled? Ocean Level Sea Level sea_&_islands Glaciers Ice Sheets Greenland Gore's Mentor OGWC Articles Summary FinancialPapers OtherMotivations PeakOil Ozone Hole Fracking Acid Rain No Limits Videos Printables Links EcoTretas Selected Emails Briffa et al (1998) data


Debunking the Climate Scam

Billions of Dollars -  Fudged Data  -  Corrupt Scientists

Greedy Green Corporations - Trillion Dollar Prize

No Warming For Two decades - Illiterate Media

Bought and Paid For Organizations


5000 Years Of Climate Change From Greenland Ice Cores

Many Peer Reviewed Papers Show CO2 FOLLOWS Temperature

Since a cause cannot follow an effect, CO2 DOES NOT cause warming.

From:

http://notrickszone.com/2017/06/29/evidence-review-suggests-humans-may-not-be-the-primary-drivers-of-co2-concentration-changes/


Evidence Review Suggests Humans May Not Be The Primary Drivers Of CO2 Concentration Changes


By Kenneth Richard on 29. June 2017

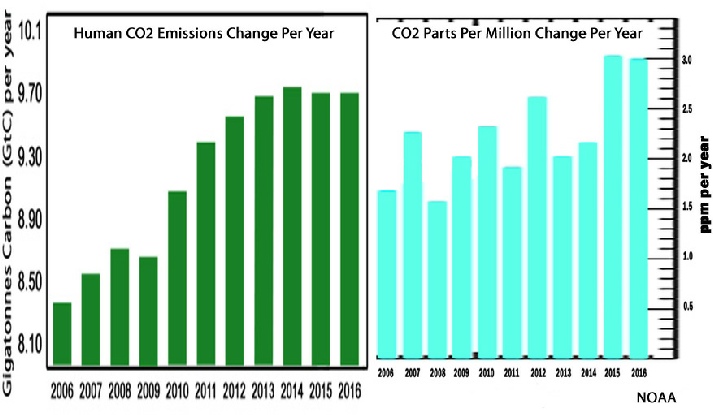
Anthropogenic Emissions ≠ CO2 Concentration Changes


For the last 3 years, human CO2 emissions rates have not risen.  In fact, according to the IEA, we burned slightly more fossil fuels in 2014 than we did in both 2015 and 2016.


Despite the lack of growth – even slight decline – in human emissions rates during 2014 – 2016, the atmospheric CO2 parts per million (ppm) concentration grew rapidly – by more than 8 ppm (397 ppm to 405 ppm).


This lack of compatibility between year-to-year human emissions rate changes and year-to-year atmospheric CO2 ppm changes has existed for quite some time.  Dr. Jamal Munshi describes it as a “necessary condition” for there to be a close correlation between annual fluctuations in human emissions and atmospheric CO2 concentrations.   And yet when he statistically analyzed the Mauna Loa record (1959-present) of CO2 concentration changes, he concluded that they did not correlate with the variance in annual anthropogenic emissions.


Munshi, 2015

“A necessary condition for the theory of anthropogenic global warming is that there should be a close correlation between annual fluctuations of atmospheric CO2 and the annual rate of anthropogenic CO2  emissions. Data on atmospheric CO2 and anthropogenic emissions provided by the Mauna Loa measuring station and the CDIAC in the period 1959-2011 were studied using detrended correlation analysis to determine whether, net of their common long term upward trends, the rate of change in atmospheric CO2 is responsive to the rate of anthropogenic emissions in a shorter time scale from year to year.  … [R]esults do not indicate a measurable year to year effect of annual anthropogenic emissions on the annual rate of CO2 accumulation in the atmosphere.”

---------------------------------------------------------------------------------------------------------------

A user-friendly visualization of this lack of correlation between year-to-year human emissions and atmospheric CO2 changes (for 2006-2016) reveals that (a) there was a rise in emissions from 2007 to 2008, but a significant decline in CO2 ppm change; (b) there was a decline in emissions from 2008 to 2009, but a rise in CO2 concentration; (c) from 2010 to 2014, there was a dramatic rise in emission rates, but an overall flat-to-declining trend in CO2 ppm changes; and as mentioned above, (d) there was a slight decline in emissions from 2014 to 2016, but a pronounced rise in year-to-year atmospheric CO2 (corresponding with the natural El Niño-induced temperature increase during 2015-’16).

---------------------------------------------------------------------------------------------------------------------


A Strong Lead-Lag Correlation Between Temperature And CO2 Changes


It has long been recognized by atmospheric scientists that temperature changes are drivers of CO2 concentration variability.  This is especially due to the physical observation that oceans – which have 50 times more dissolved CO2 than the atmosphere does – release more of their vast stores of CO2 during warm years, and they retain more CO2 during anonymously cool years.   For example, Flohn (1982) observed that the oceans contribute almost twice as much to the CO2 concentration change during warm-water years (El Niño) as they do in cool-water years (La Niña), and that the variance in atmospheric CO2 growth is “independent from” anthropogenic CO2 emissions.


Flohn, 1982

“The recent increase of the CO2-content of air varies distinctly from year to year, rather independent from the irregular annual increase of global CO2-production from fossil fuel and cement, which has since 1973 decreased from about 4.5 percent to 2.25 percent per year (Rotty 1981).”

“Comparative investigations (Keeling and Bacastow 1977, Newll et al. 1978, Angell 1981) found a positive correlation between the rate of increase of atmospheric CO2 and the fluctuations of sea surface temperature (SST) in the equatorial Pacific, which are caused by rather abrupt changes between upwelling cool water and downwelling warm water (“El Niño”) in the eastern equatorial Pacific.  Indeed the cool upwelling water is not only rich in (anorganic) CO2 but also in nutrients and organisms. (algae) which consume much atmospheric CO2 in organic form, thus reducing the increase in atmospehreic CO2. Conversely the warm water of tropical oceans, with SST near 27°C, is barren, thus leading to a reduction of CO2 uptake by the ocean and greater increase of the CO2. … A crude estimate of these differences is demonstrated by the fact that during the period 1958-1974, the average CO2-increase within five selective years with prevailing cool water only 0.57 ppm/a [per year], while during five years with prevailing warm water it was 1.11 ppm/a.  Thus in a a warm water year, more than one Gt (1015 g) carbon is additionally injected into the atmosphere, in comparison to a cold water year.”


-----------------------------------------------------------------------------------


In the undergraduate-level textbook Physics of the Atmosphere and Climate, Dr. Murry Salby affirms the observation that temperature changes are a significant determinant of atmospheric CO2 changes.

“Warming of SST (by any mechanism) will increase the outgassing of CO2 while reducing its absorption. Owing to the magnitude of transfers with the ocean, even a minor increase of SST can lead to increased emission of CO2 that rivals other sources.” pg. 546

“The results for the two periods are in broad agreement. Together with the strong dependence of CO2 emission on temperature, they imply that a significant portion of the observed increase in r˙CO2 derives from a gradual increase in surface temperature.”  pg. 253

“Surface temperature depends on the atmosphere’s optical depth. The latter, in turn, depends on atmospheric composition through radiatively active species. Water vapor is produced at ocean surfaces through evaporation. Carbon dioxide is produced by decomposition of of organic matter. These and other processes that control radiatively active species are temperature dependent.” pg 249, 250

“Together, emission from ocean and land sources (∼150 GtC/yr) is two orders of magnitude greater than CO2 emission from combustion of fossil fuel. These natural sources are offset by natural sinks, of comparable strength. However, because they are so much stronger, even a minor imbalance between natural sources and sinks can overshadow the anthropogenic component of CO2 emission.” pg. 546


Read much more at the source:  http://notrickszone.com/2017/06/29/evidence-review-suggests-humans-may-not-be-the-primary-drivers-of-co2-concentration-changes/


MORE:

https://wattsupwiththat.com/2018/09/09/empirical-evidence-shows-temperature-increases-before-co2-increase-in-all-records/