Debunking the Climate Scam
Billions of Dollars -
Greedy Green Corporations -
No Warming For Two decades -
Bought and Paid For Organizations

5000 Years Of Climate Change From Greenland Ice Cores

A look at treemometers and tree ring growth
Posted on September 28, 2009 by Anthony Watts
 Since there has been a huge amount of interest in Steve McIntyre’s recent discovery
of what happens to the “hockey stick” when all of the Yamal tree ring data is used
rather than a special subset of 10, I thought it might be a good time to talk about
how tree rings are grown.
Several readers have correctly pointed out that trees don’t respond just to temperature. The also respond to available water, available nutrients in soil, and available sunlight. For example, the only time in modern history where some trees did not produce summer growth rings occurred in the year 1816, also known as the Year Without a Summer:
Many consider the Year Without a Summer to have been caused by a combination of a historic low in solar activity (The Dalton Minimum) and a volcanic winter event; such as the powerful Mount Tambora eruption in 1815 which had four times the power of the famous Krakatoa eruption and hurled huge amounts of aerosols into the atmosphere.
Obviously, sunlight was a limiting factor for tree growth then, reduced temperature also figured in.
I touched on the idea of trees used for dendroclimatology being rain gauges before: Bristlecone Pines: Treemometers or rain gauges ? There has obviously been years of drought when trees also did not grow as much, so how do we separate temperature and moisture in the growth analysis?
But, right now what I really want to introduce readers to is Leibig’s Barrel.
While I don’t like to use Wikipedia that much, this page doesn’t seem to be controversial so appears safe enough:
Liebig’s Law of the Minimum, often simply called Liebig’s Law or the Law of the Minimum, is a principle developed in agricultural science by Carl Sprengel (1828) and later popularized by Justus von Liebig.
It states that growth is controlled not by the total of resources available, but by the scarcest resource (limiting factor). This concept was originally applied to plant or crop growth, where it was found that increasing the amount of plentiful nutrients did not increase plant growth. Only by increasing the amount of the limiting nutrient (the one most scarce in relation to “need”) was the growth of a plant or crop improved.This principle can be summed up in the aphorism, “The availability of the most abundant nutrient in the soil is as available as the availability of the least abundant nutrient in the soil.”
Liebig's barrel -
Liebig used the image of a barrel—now called Liebig’s barrel—to explain his law. Just as the capacity of a barrel with staves of unequal length is limited by the shortest stave, so a plant’s growth is limited by the nutrient in shortest supply.
Liebig’s Law has been extended to biological populations (and is commonly used in
ecosystem models). For example, the growth of an organism such as a plant may be
dependent on a number of different factors, such as sunlight or mineral nutrients
(e.g. nitrate or phosphate). The availability of these may vary, such that at any
given time one is more limiting than the others. Liebig’s Law states that growth
only occurs at the rate permitted by the most limiting. For instance, in the equation
below, the growth of population O is a function of the minimum of three Michaelis-
It is limited to a situation where there are steady state conditions, and factor interactions are tightly controlled.
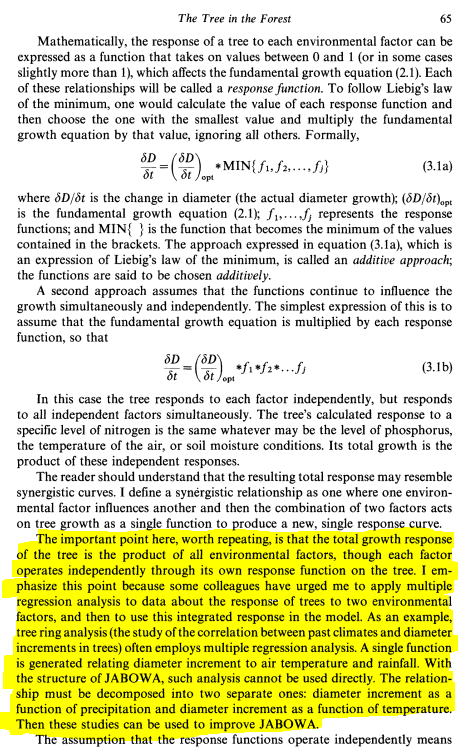
In the book: Forest dynamics: an ecological model, 1993, Oxford University Press, By Daniel B. Botkin the relationship between all of the different growth factors is modeled per Liebigs Law. In Chapter 3, page 64 the author talks about Liebigs Law and how it operates on forest populations. He then goes no to describe a model of forest growth.
Page 65 has a very interesting passage which I’ve highlighted:

For our readers reference, JABOWA is his forest modeling software, now in version 3 which you can read about here and download a free trial. It was designed for a specific region, the Northeastern United States. From JABOWA another similar forest growth simulator FORET was derived, which has been adapted for modeling diverse forests of the southern United States. Obviously modeling different forest regions requires specific model programming.
The point I’m making with all this is: If “the total growth response of a tree is the product of all environmental factors”, and forest modelers have to separate temperature and precipitation diameter increments, plus create different models for different forest regions, how can then one accurately divine temperature over millenia from width analysis of tree ring growth from trees in a single region?
The task is huge.
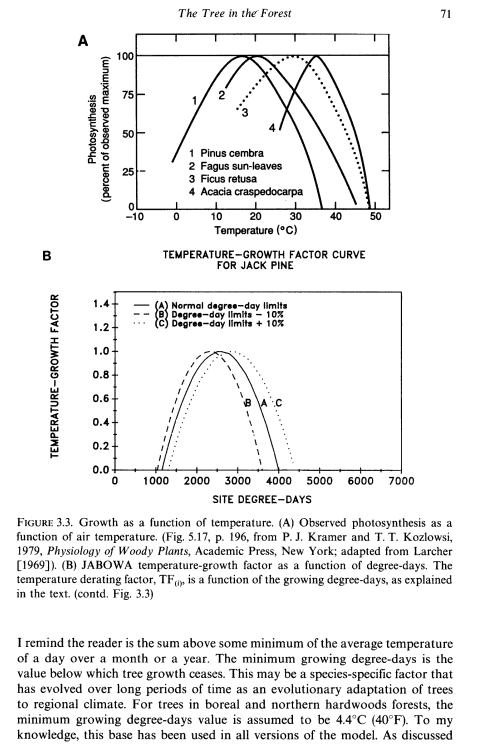
It seems to me that temperature is intertwined with so many other factors that it can’t easily be separated without at least knowing how they also changed over time. Further on in the book the author goes on to talk about other limiting growth factors, such as soil moisture, available light, nutrients etc, but a couple of pages, 71 and 72, really described how temperature (as degree days) is figured into forest growth estimates. I was surprised to see that photosynthesis is not linear with temperature, but parabolic! I’ve excerpted the pages below.

Another interesting thing I learned was that to accurately gauge forest growth, you should have nearby weather records. Missing that, you can estimate the temperature profile from January and July average temperatures. OK but how do you do that for 200, 500, or 1000 years ago?

Barring having any temperature information from the region at all, the possibility exists for doing lab growth experiments, though I don’t recall seeing anything about that in MBH98 or similar papers.
I make no claims of being an expert in either forest growth or dendroclimatology. I’m simply presenting interesting information here for discussion.
But, I am amazed at the nonlinearity and interactivity of all limiting growth factors, and especially the parabolic response to temperature.
Thus in my opinion, it seems rather difficult to estimate forest growth when parameters are known, and even then the outcome is uncertain.
Imagine trying to reverse engineer temperature from forest growth (using tree rings) with all of the simultaneously acting growth factors, population density and shade limiting, the parabolic response curves, and you realize that divining the temperature out of trees over millenia is a very difficult, nonlinear, and uncertain task.
If you see a wide tree ring, you can safely conclude the tree had a good year. If you see narrow rings you can conclude a poor growth year. But was that poor year a product of an unfavorable temperature range alone? Or was it due to lack of moisture or lack of sunlight or both? Not having local records for those, how would you know?
It seems to me that dendroclimatology has a lot of uncertainty.
This entry was posted in paleoclimatology. Bookmark the permalink.
This page copied from Watts Up With That?

| Warming Stopped |
| NOAA Data |
| NorthWest |
| Oregon |
| Washington |
| Extreme Weather |
| Past Was Warmer |
| NASA: 30's Hotter |
| PastBeliefs |
| HistoryOFAlarmism |
| Central England |
| Temperature History |
| MultiProxy |
| treemometers |
| Northwest Passage |
| Acidification-Ball |
| Acidification-Fulks |
| Acidification-Idso |
| Selected Emails |
| CRU Emails - html formatted |
| CRU Emails Simple Format |
| CRU Emails UnFormatted |
| DCPS paper |
| CRU_Files_Notice |
| False Deadlines |
| Hockey Stick Links |